AI-powered meal photo analysis
Scan a meal with your camera or pick from your gallery. AI identifies ingredients and estimates carbs, protein, fat, and calories. Review and adjust every item before saving.
CarbTrack estimates carbs from meal photos, lets you log blood glucose with context, shows how each meal impacts your glucose with charts, and helps you discover patterns across days, weeks, and months.
CarbTrack is designed for consistency: quick capture, careful review, and patterns that emerge over time.
"The meal impact view changed how I think about food choices. Seeing the glucose curve after a high-fat meal versus a balanced one is eye-opening."
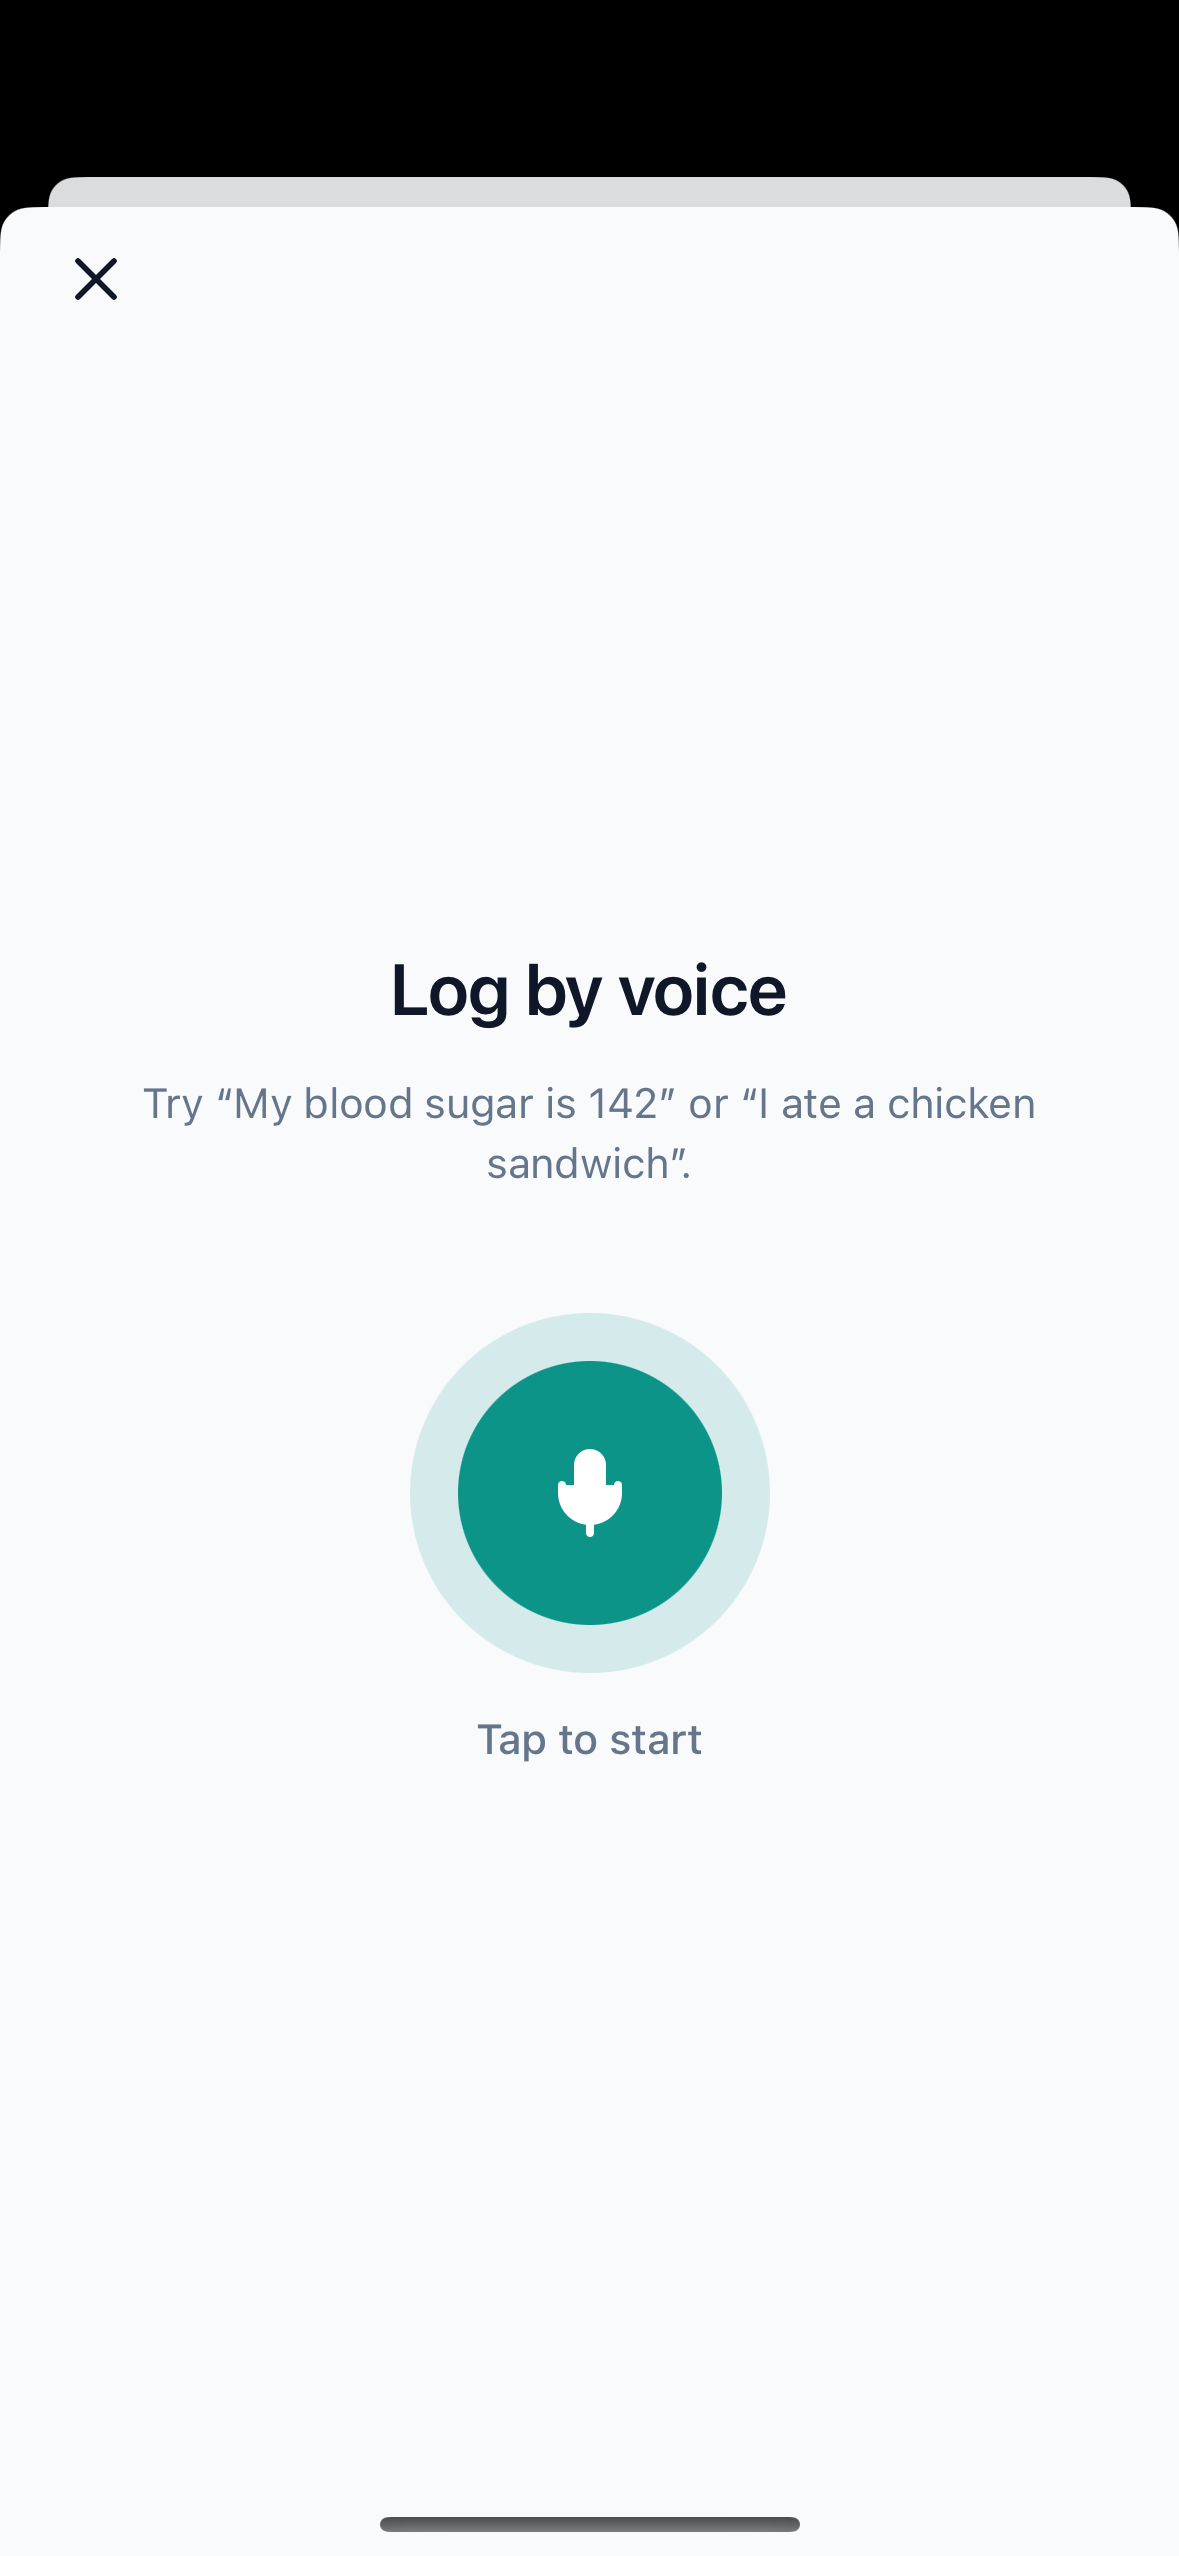
"I use the voice logger when I'm out and don't want to type. 'Log 120 fasting and a chicken salad with 30g carbs' and it's done."
"The patterns tab spots things I'd miss on my own. The weekly overnight trend card helped me bring real data to my endo appointment."
From AI-powered meal scanning to glucose pattern discovery — one integrated workflow.
Scan a meal with your camera or pick from your gallery. AI identifies ingredients and estimates carbs, protein, fat, and calories. Review and adjust every item before saving.
Build a plate from a catalog of common ingredients with category filters. Set portion sizes, add custom ingredients, and log with date and time.
Record readings with context labels — fasting, pre-meal, post-meal, bedtime. View a 24-hour trend sparkline and log with optional notes.
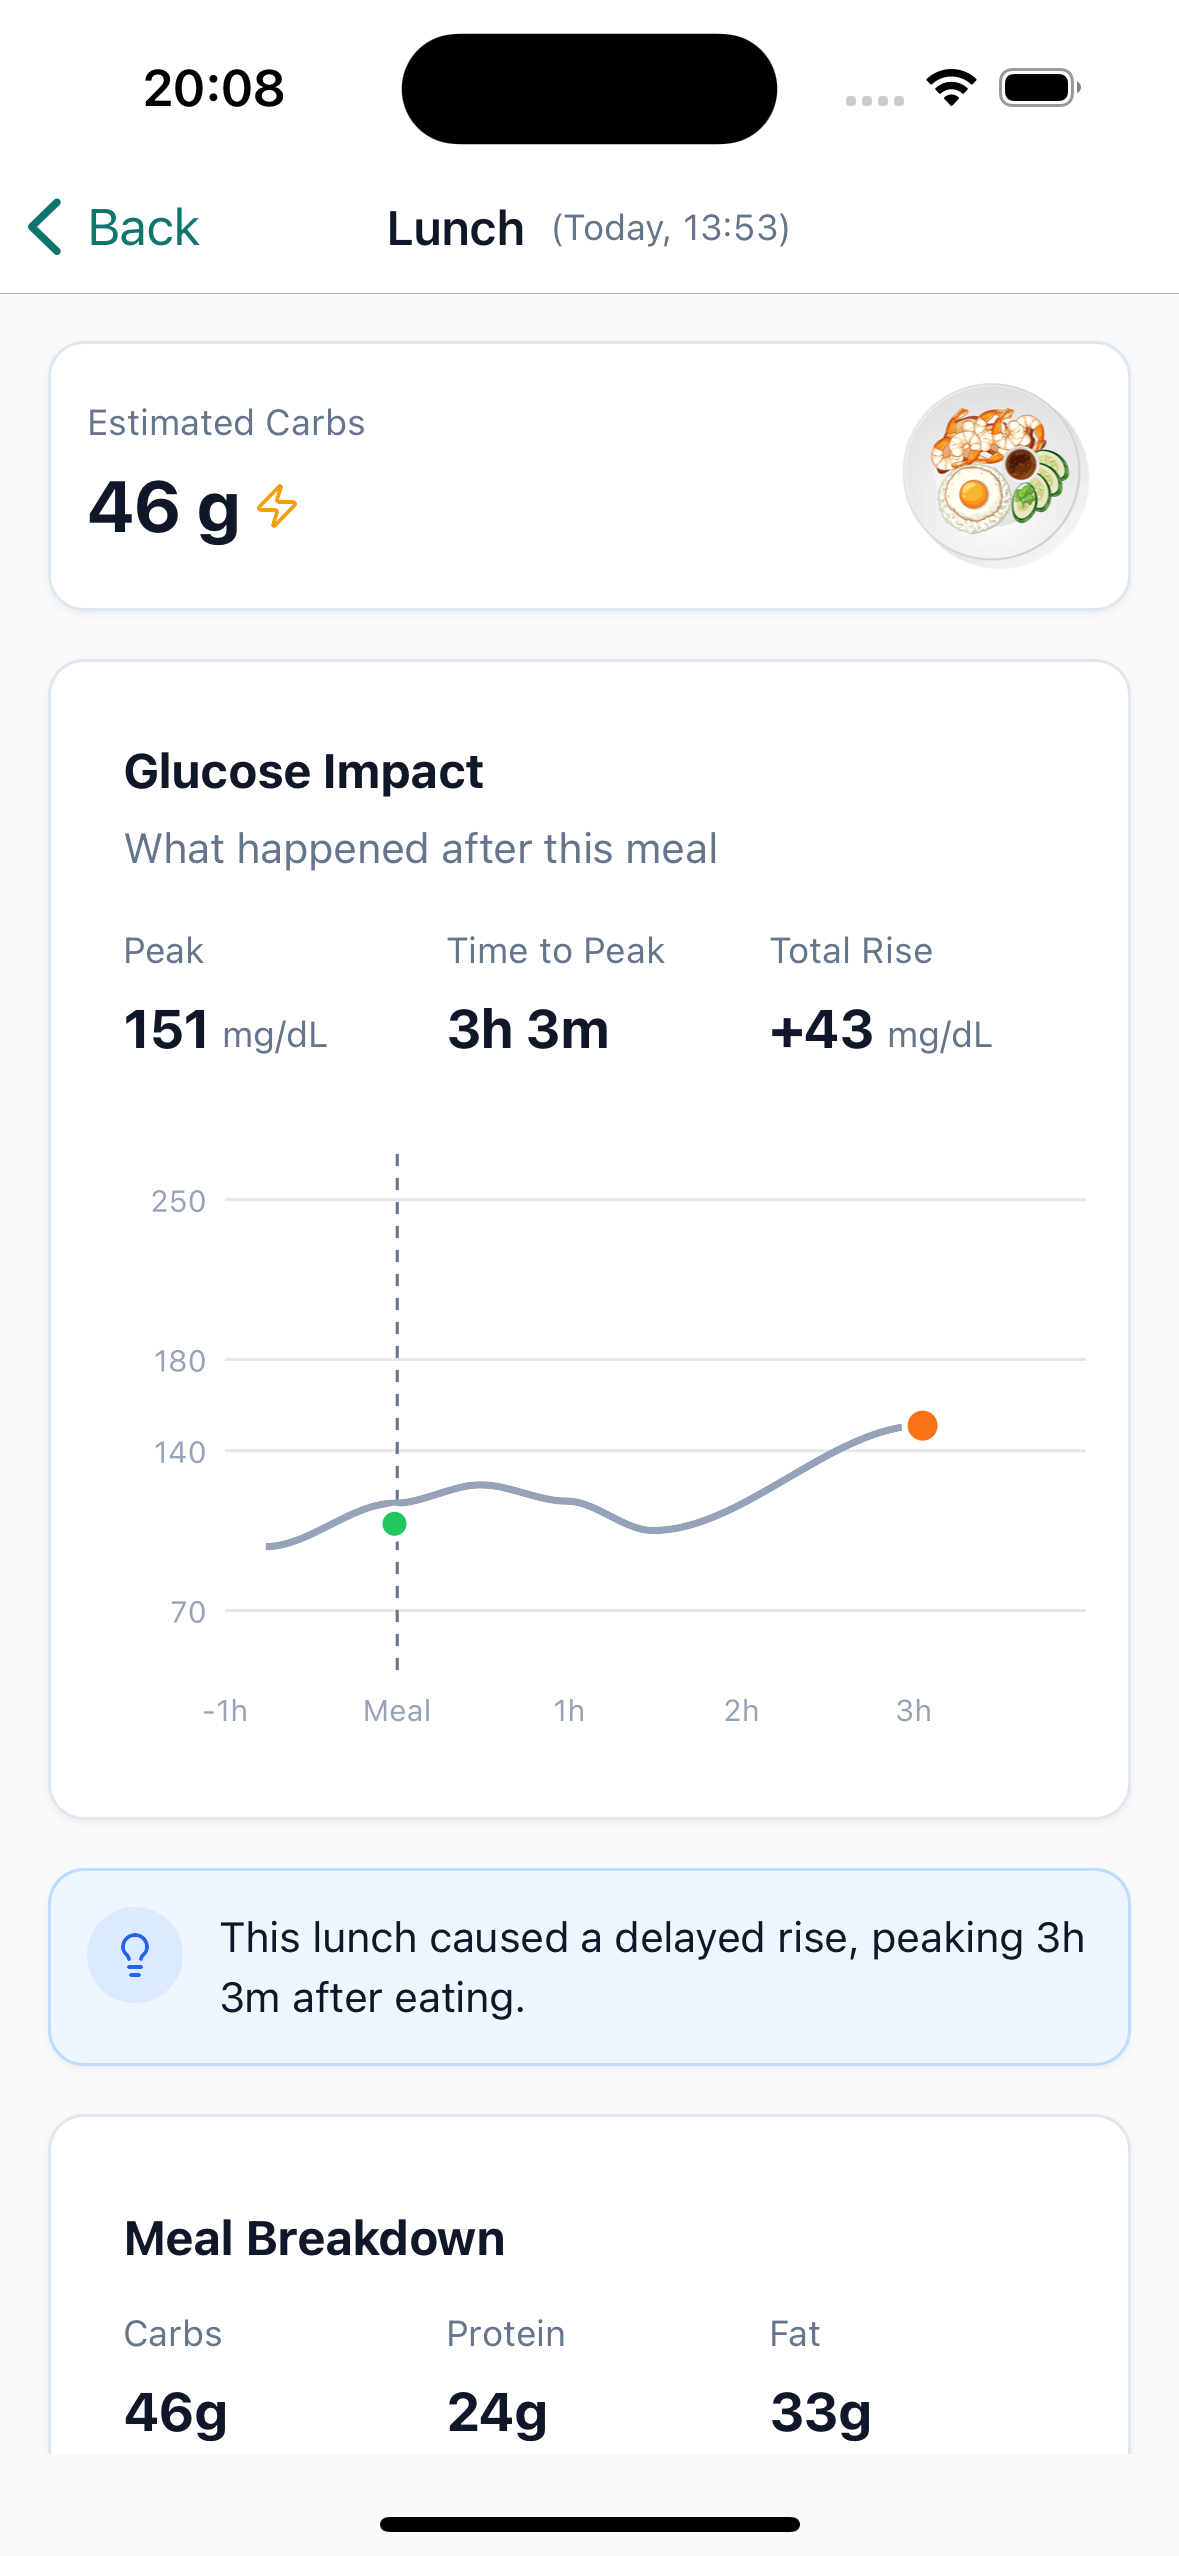
See exactly how a meal affected your glucose: baseline, peak, time to peak, and a full 4-hour post-meal curve with AI-generated interpretation.
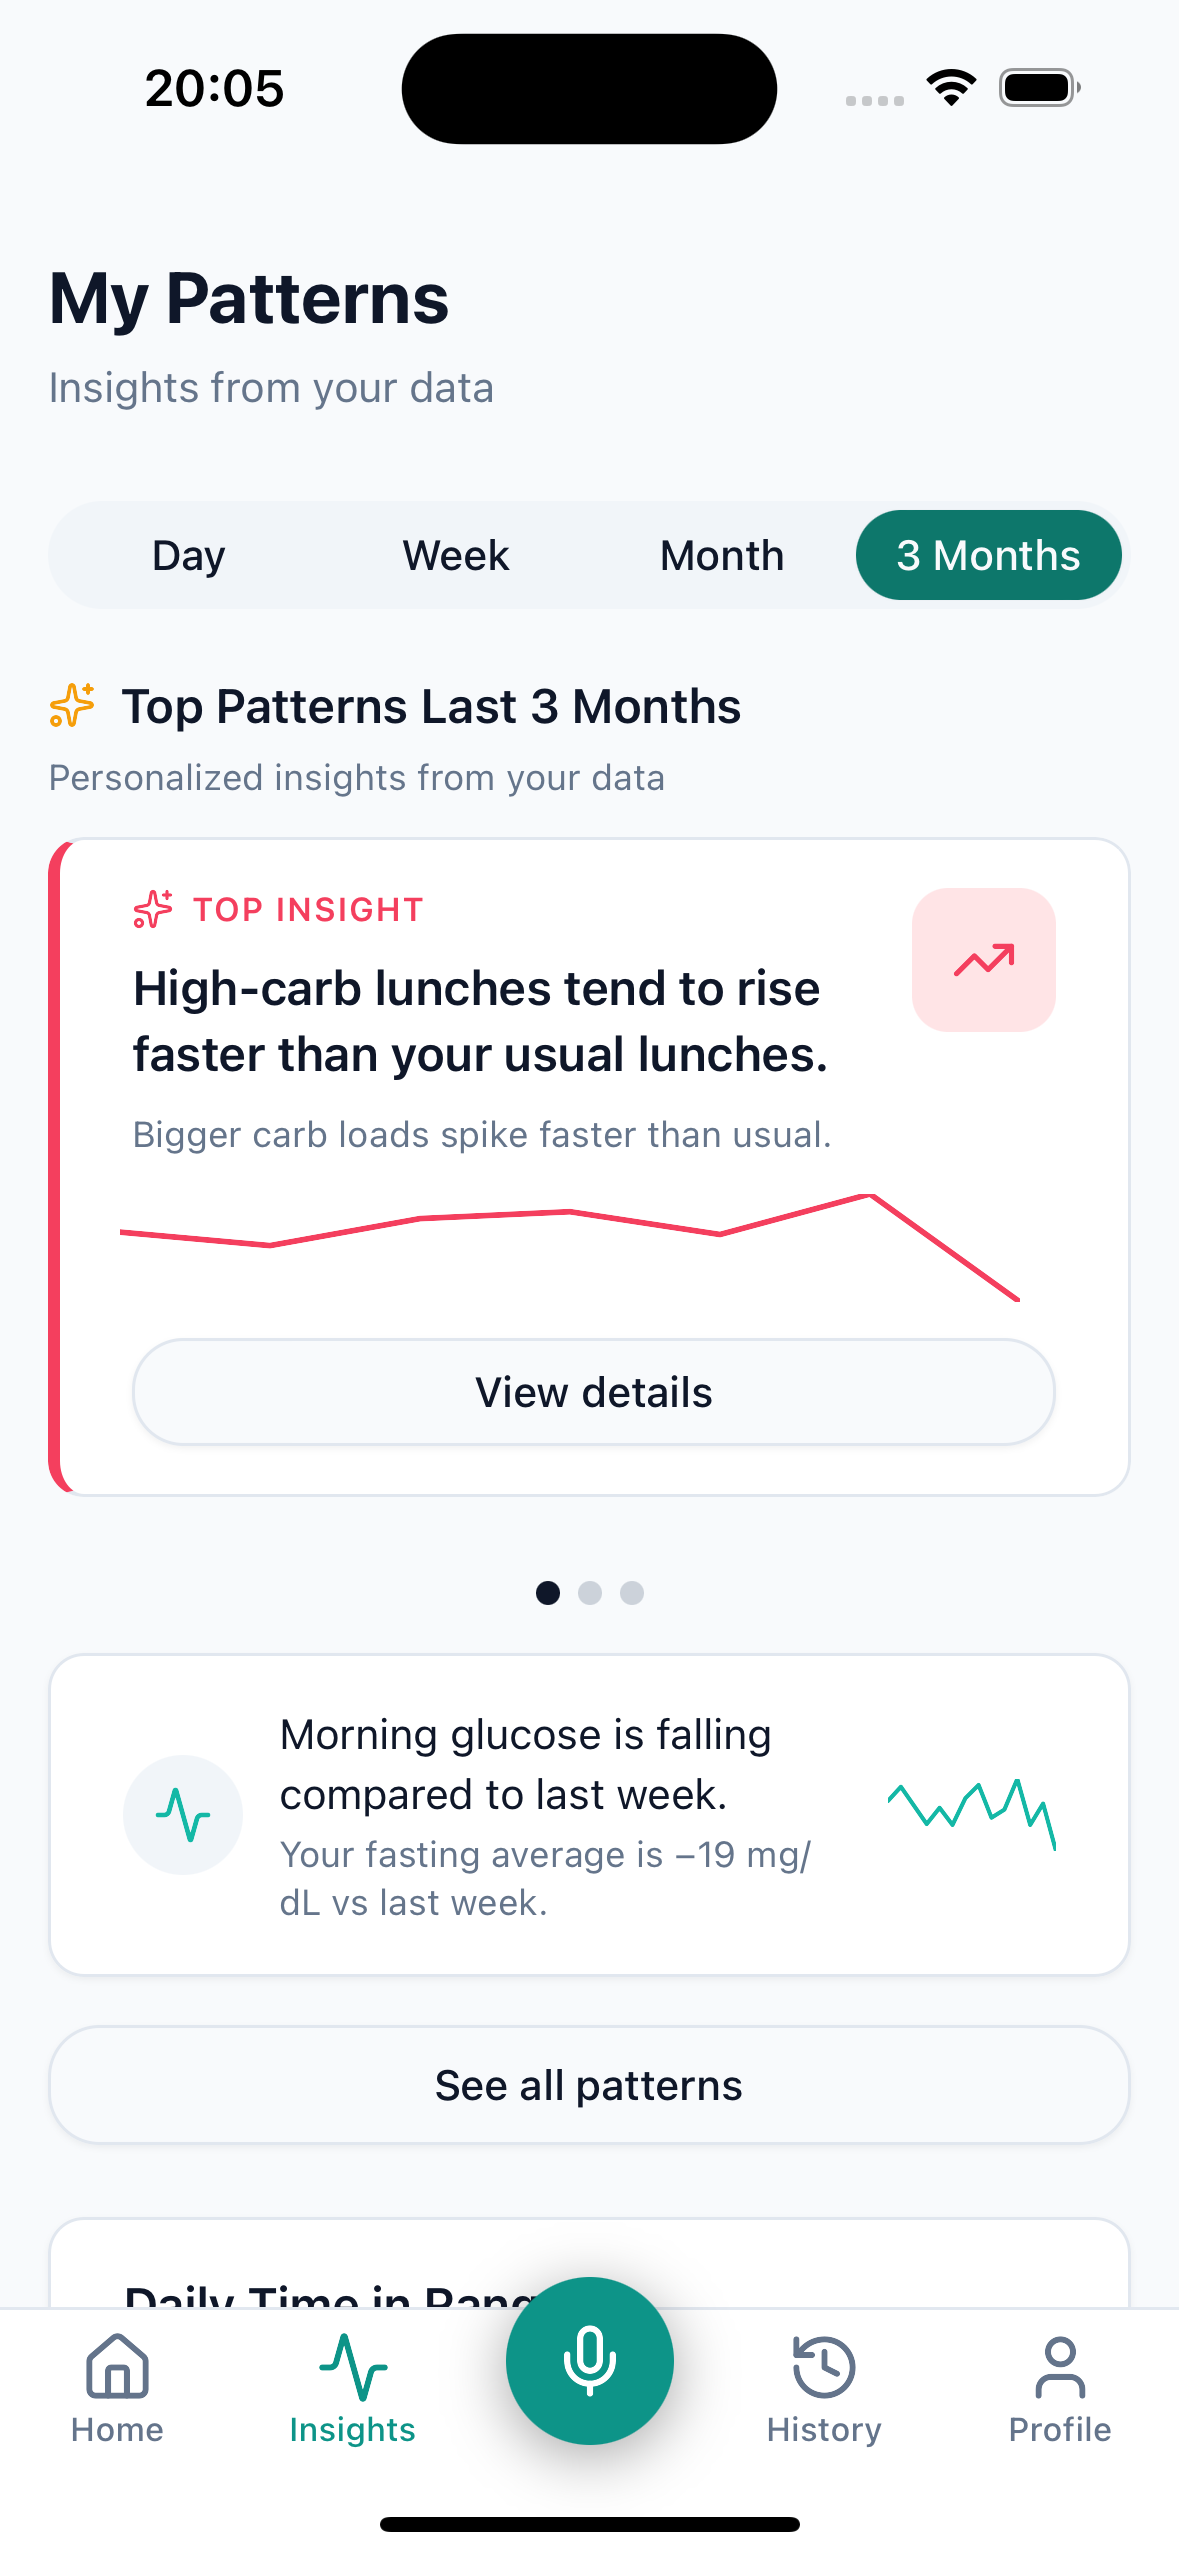
Hero patterns with sparklines, time-in-range charts, and daily/weekly/monthly trend views. Drill into each pattern for comparison metrics, hourly distributions, and actionable tips.
Speak to log glucose readings and meals in one go. CarbTrack transcribes, extracts structured entries, and lets you review before saving.
Connect LibreView/LibreLinkUp or Dexcom Share to pull CGM readings automatically. Readings appear in your history, charts, and meal impact views.
See meals, glucose readings, and events on a combined SVG timeline. Color-coded response labels — stable, sharp rise, delayed, slow recovery — make patterns visible at a glance.
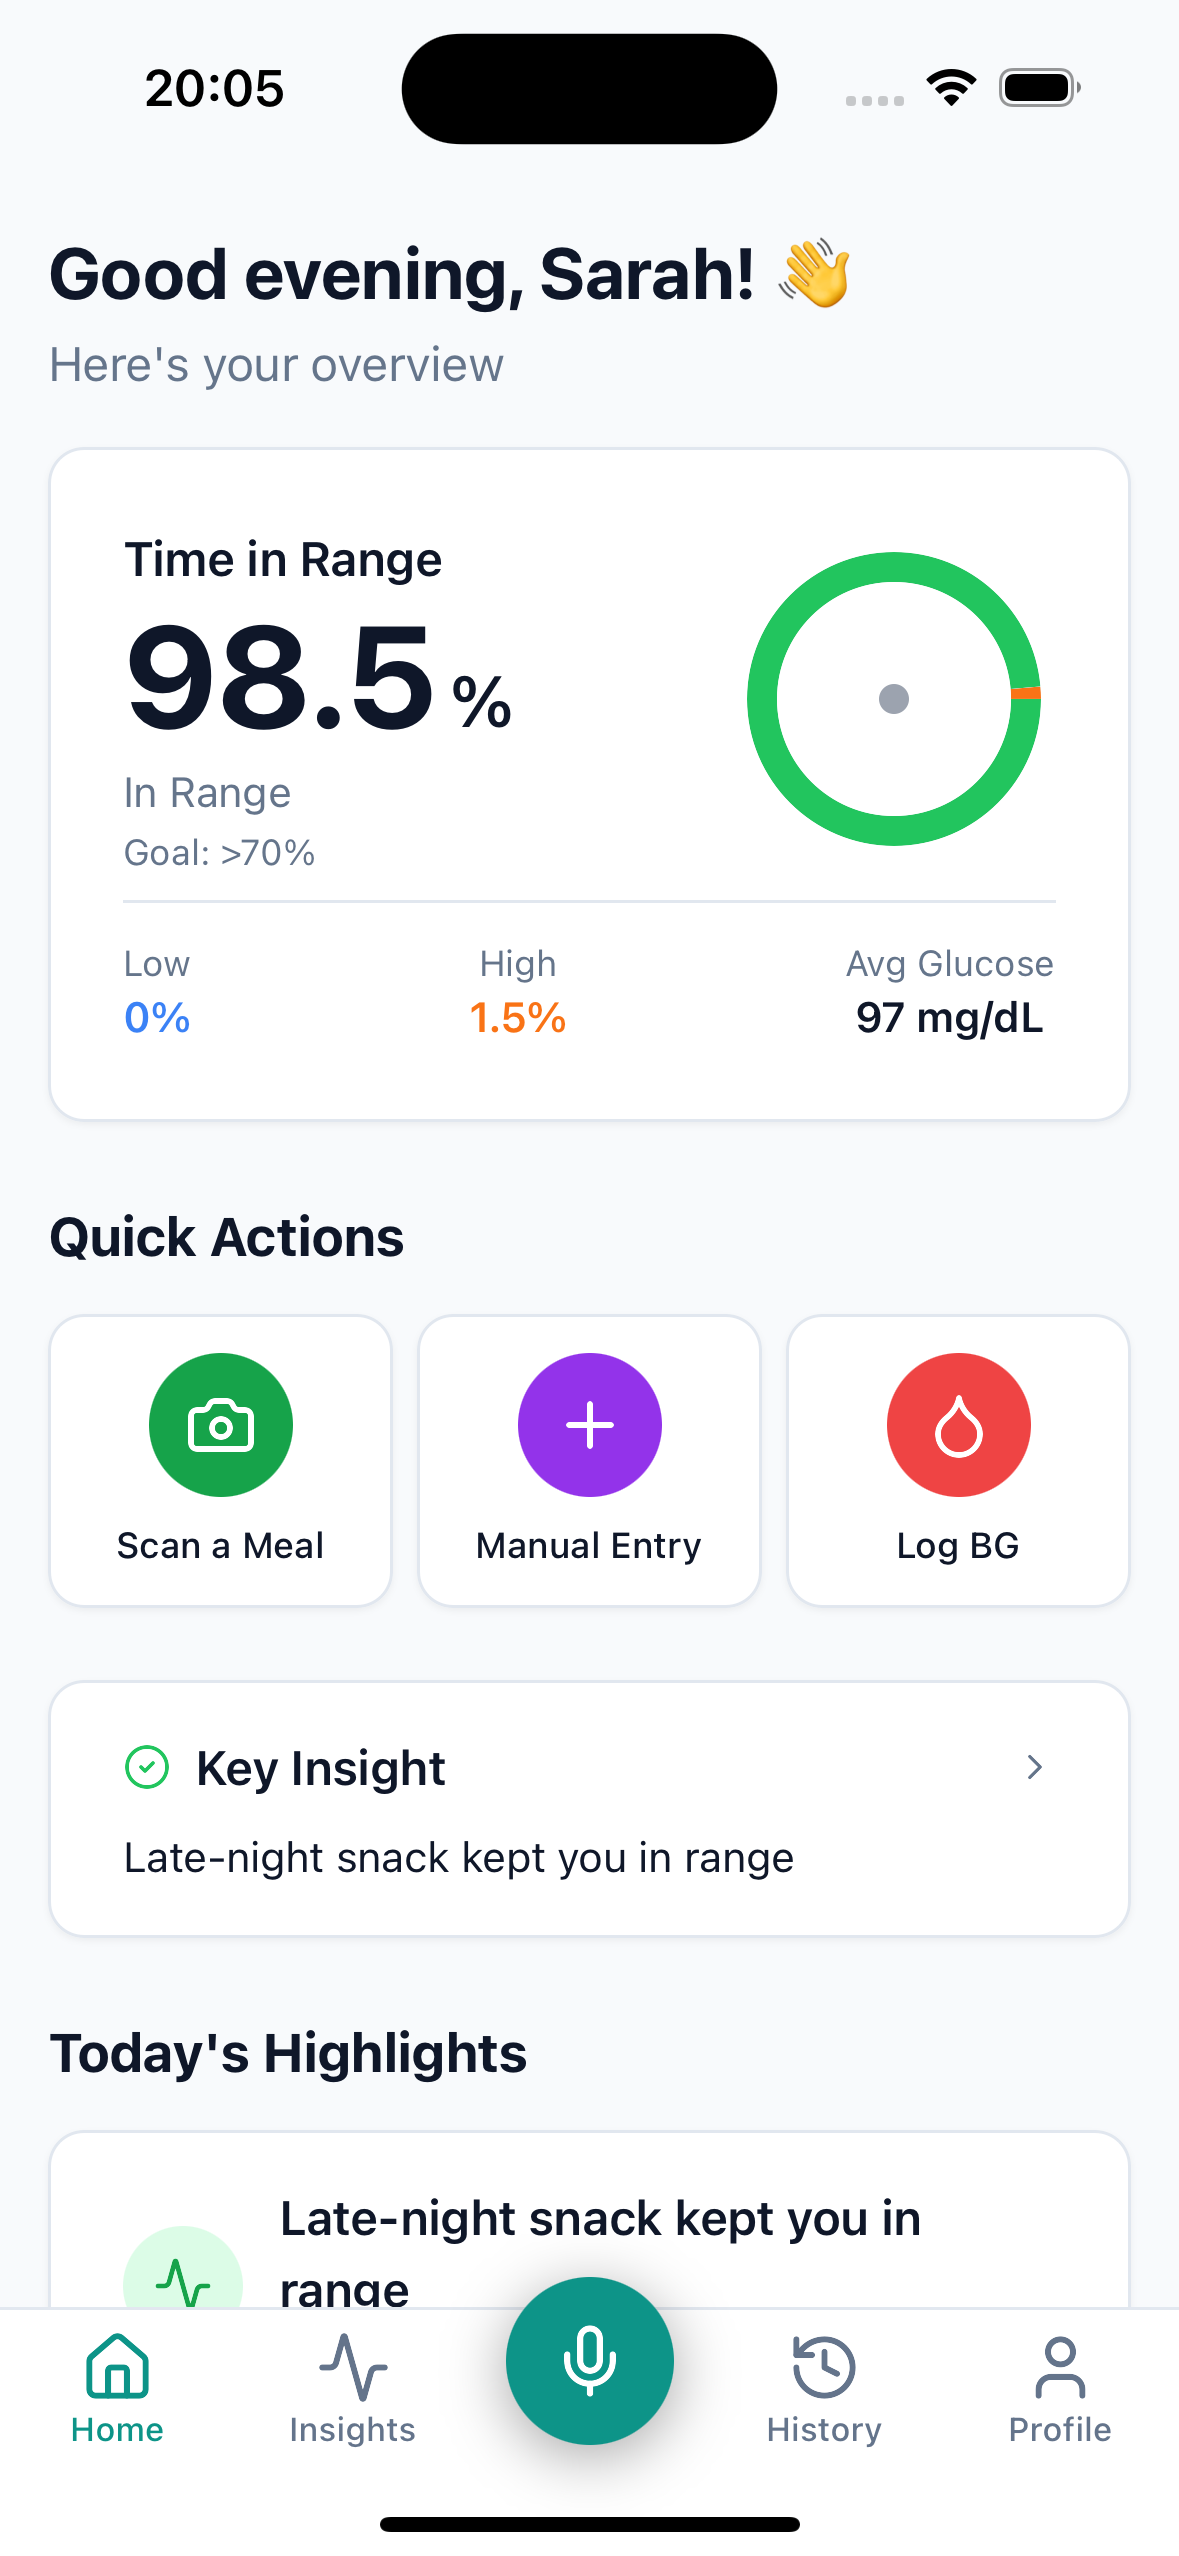
Time-in-range donut chart, average glucose, quick-action shortcuts, key daily insights, and today's meal highlights — all on one screen.
A calm, repeatable workflow designed for daily diabetes management.
Take a photo or search ingredients manually. Add meal name and when you ate it.
AI suggests ingredients and macros. Edit portions, add missing items, and confirm before saving.
Record readings with fasting, pre/post-meal, or bedtime context. Or sync CGM data automatically.
See meal impact charts, weekly summaries, and pattern insights that build over time.
A quick tour of the CarbTrack experience.
Quick answers about meal analysis, logging, CGM sync, and pattern discovery.
Estimates vary with portion size, mixed dishes, and lighting. CarbTrack is designed for an "estimate → review → adjust → save" workflow so you can edit every ingredient before it becomes part of your history.
Yes. Manual entry lets you search a catalog of common ingredients, filter by category, adjust portions, and add custom items. You can also use voice logging to speak your meal entries hands-free.
Yes. You can connect LibreView/LibreLinkUp or Dexcom Share to pull CGM readings automatically. Readings are labeled as CGM context and appear in your history, charts, meal impact views, and daily timeline.
For each logged meal, CarbTrack can show the glucose response: your pre-meal baseline, post-meal peak, time to peak, and a full glucose curve over 4 hours — plus an AI-generated interpretation of what the data suggests.
No. CarbTrack provides informational estimates and logging tools. It does not provide medical advice, diagnosis, or treatment. Always consult a qualified clinician regarding medical decisions.